Parameter Optimization for the Fe-Cr-Ni Ternary System
Purpose: Learn to optimize thermodynamic parameters for a ternary system.
Module: PanOptimizer
Database: Fe-Cr-Ni_OPT.tdb
pop file: Fe-Cr-Ni_OPT.pop
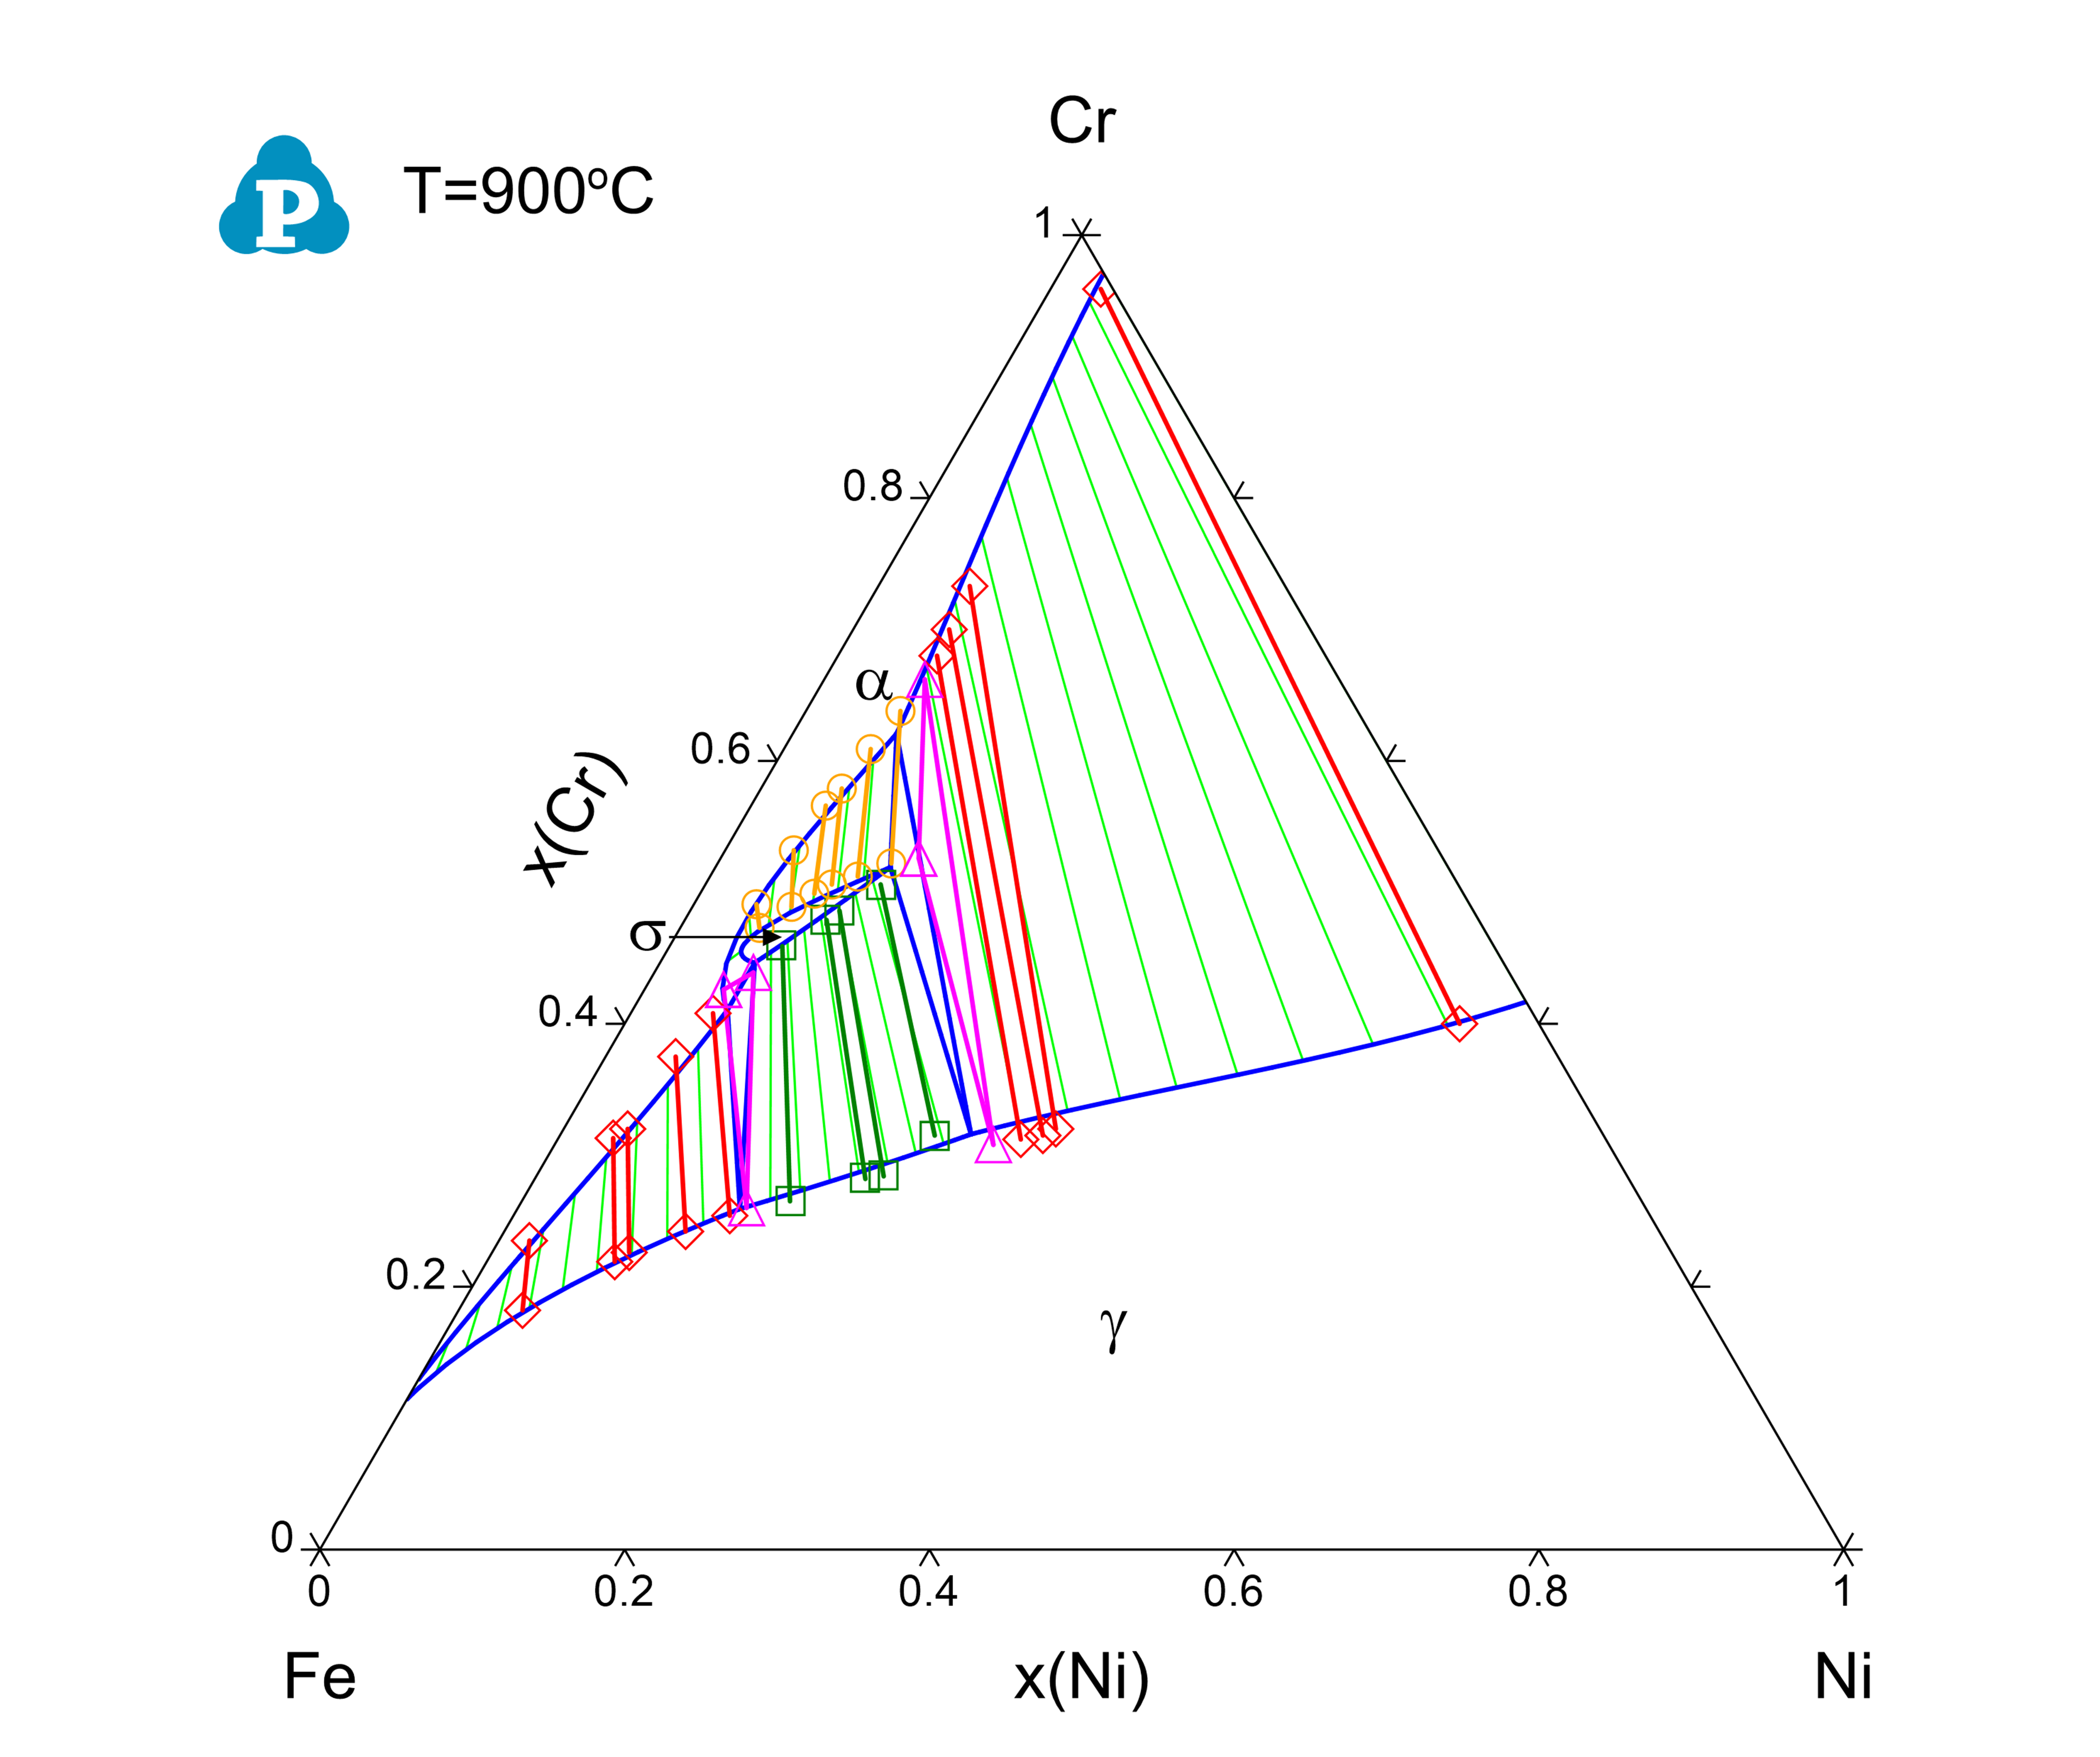
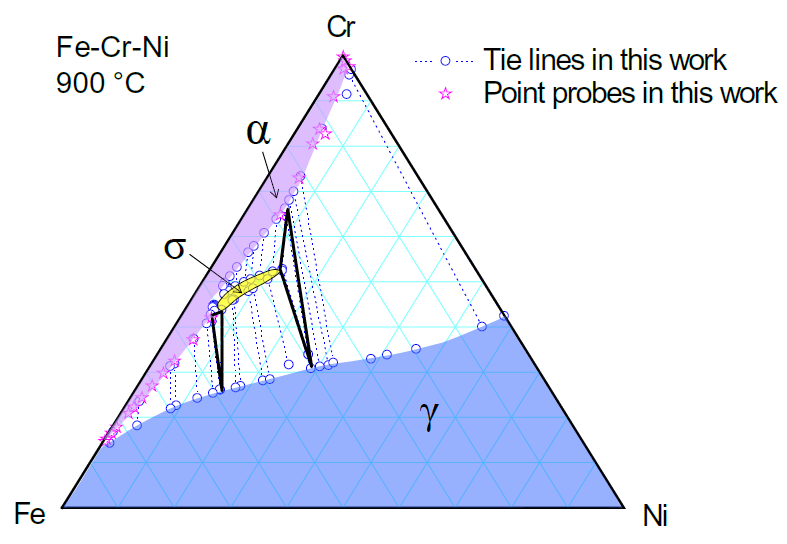
Figure 1 shows an experimentally determined isothermal section of the Fe-Cr-Ni ternary system at 900°C. Two solution phases, Bcc (a) and Fcc (g), and one intermetallic compound (s) are stable at this temperature. The experimental data includes tie-lines (equilibrium between two different phases) and tie-triangles (equilibrium of three different phases). This example shows how to optimize the thermodynamic parameters for this system using the given experimental data.
Prepare file:
-
Prepare the database file and pop following the procedure in Pandat User's Guide: Step 1: Prepare Files ;
The binary thermodynamic parameters are selected from literature, which are proven to describe the corresponding binary systems precisely. And the ternary interaction parameters are set for optimization. User may go through the database file (Fe-Cr-Ni_OPT.tdb) for more details.
The experimental data are input into the pop file (Fe-Cr-Ni_OPT.pop). The tie-lines are stored in table format by giving an overall alloy composition at themidpoint of the each tie-line. The tie-triangles are input by giving an overall alloy composition at centre point of each triangle. In both cases, the phases use "ENTER" status so that PanOptimizer can easily find the corresponding equilibrium.
Perform Optimization:
-
Load the database and experimental files (tdb and pop files) following the procedure in Pandat User's Guide: Step 2: Carry Out Optimization ;
User may check the parameters to be optimized by clicking the "Parameters" button on the optimization control panel, and check the difference between calculated equilibrium and experiments by clicking the "Experimental Data" button as shown in the red box in Figure 2;
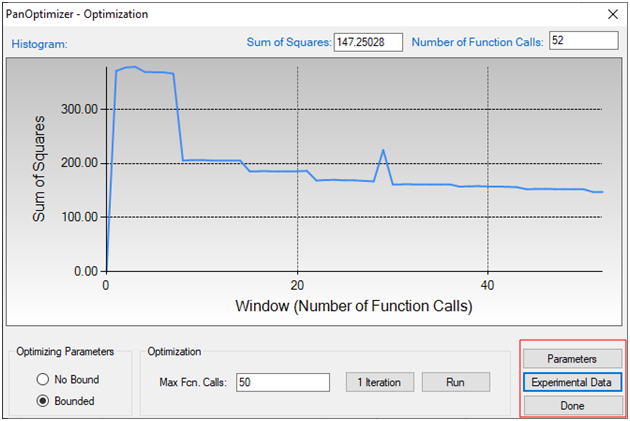
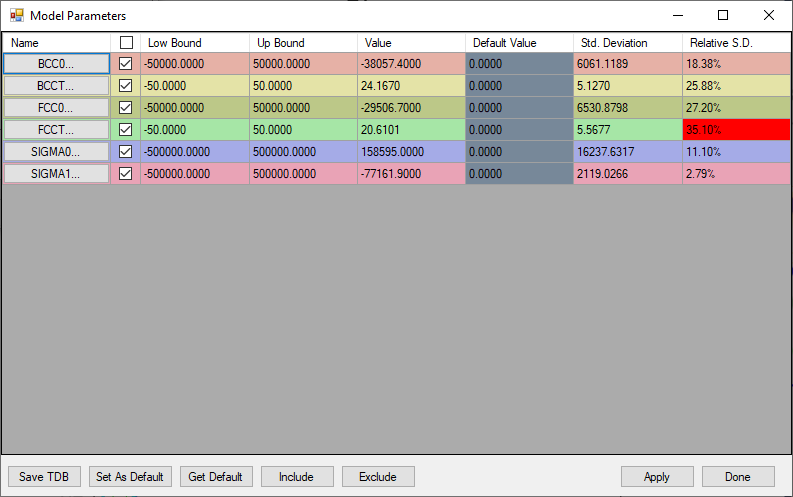
After several runs of optimization, the sum of squares will reach a minimum and does not change, which means PanOptimizer has found an optimal result for the parameters. User may calculate an isothermal section at 900 °C and compare to the experimental data. As shown in Figure 3, the calculated phase boundaries are in good agreement with the experimental data. And user may also need to check the values of the parameters and make sure that they are reasonable as shown in Figure 4. If there is noticeable difference between calculated boundary and the experimental data, user need to figure out new ternary parameters that need to be included in optimization or using more complicated model to describe the corresponding phases.